|
Firstly a detailed explanation of the functioning of the diode detector, including a full and lucid exposition of the working conditions necessary for distortionless rectification.
The simple diode valve, containing only a cathode and an anode, was the earliest type of thermionic detector. For a good many years it dropped almost entirely out of use, but recent changes in receiver design, especially those bound up with the problems of automatic volume control, have radically altered the requirements that the detector is called upon to meet. As a result there are many modern sets in which the diode provides the best and most convenient method of detection.
The necessity for detection arises, and we noted that this function can be performed by any device conducting current more readily in one direction than the other. The diode, in which electrons can flow from cathode to anode but not from anode to cathode, satisfies fully this fundamental requirement.
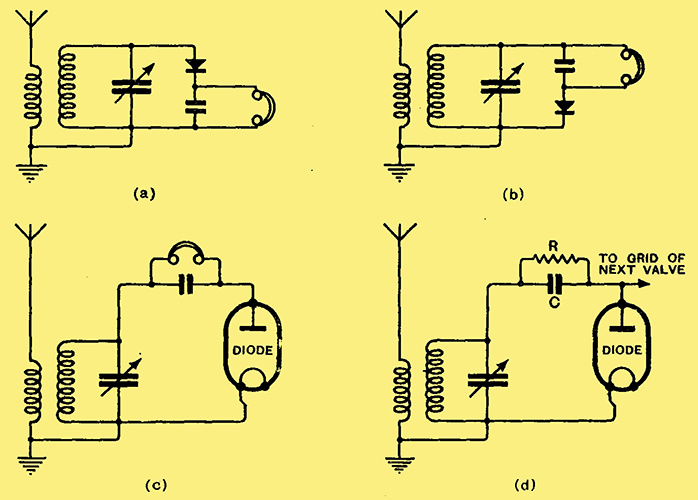
Fig. 1. - Comparing crystal and valve detectors, and leading up to the practical diode circuit of diagram (d).
The circuit of the crystal detector is reproduced in Fig. 1a. The rectifying action of the crystal produces modulation-frequency currents which flow through the telephones. Apart from certain practical disadvantages, the circuit of Fig. 1b, where crystal and telephones, still in series, are interchanged in position, would work as well. Since one side of the crystal is now at earth potential, it could conveniently be replaced by a diode valve without making any alteration in the working of the circuit, which now becomes as shown at c.
In general, we do not desire to listen in telephones when using a receiver employing valves, but prefer to amplify further and to use a loud speaker. Instead of using the current through the telephones, we should therefore pick up the modulation-frequency voltage at the anode of the diode and pass it to the grid of a succeeding valve. Telephones would hardly be chosen as the impedance across which to allow the current to develop this voltage; a resistance is much smaller and cheaper. We should use, in short, the circuit of Fig. 1d, which is the same as the circuit at c, except for the replacement of the telephones by the resistance R.
The resistance is generally made much higher than that of the telephones that it replaces. The rectified current contains a steady component as well as the audio-frequency component required, therefore produces across it a DC voltage which alters the operating conditions of the diode.
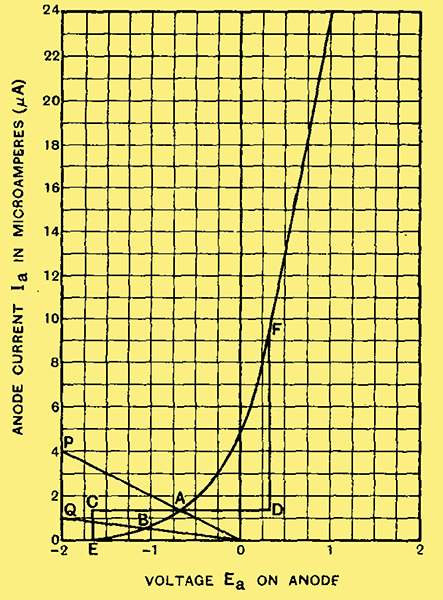
Fig. 2. - Characteristic curve of a. diode detector-valve. Load lines OP, OQ are shown for resistances of 0.5 MΩ and 2 MΩ connected as in Fig. 1d.
The mechanism of the process by which this steady potential is generated can be understood by a study of Figs. 2 and 3. In the former is shown the curve relating anode voltage to anode current in the diode. It is to be noted that at Ea = 0 the anode current is not zero. In Fig. 1d R is returned, through the tuned circuit, to the cathode (zero voltage); some anode current must flow through it, thus setting up across it a voltage-drop which makes the anode slightly negative. By drawing a load line on Fig. 2, as shown, the initial voltage on the anode can be determined. The load-line for a 0.5 MΩ resistance is shown at OP; one end at zero volts and zero current, the other at -1 V, 2 μA, at -2 V, 4 μA, or any other point giving the voltage-current relationship across a resistance of this value. The intersection, at A, of the load-line with the curve reveals the initial voltage and current of the anode. (Verification: At A, E = -0.67 V; to get this voltage-drop across 0.5 MΩ requires I = 1.34 μA. The curve shows this to be the value of Ia at Ea = - 0.67 V) The line OQ is that for a 2 MΩ resistance, leading to the initial no-signal condition at B.
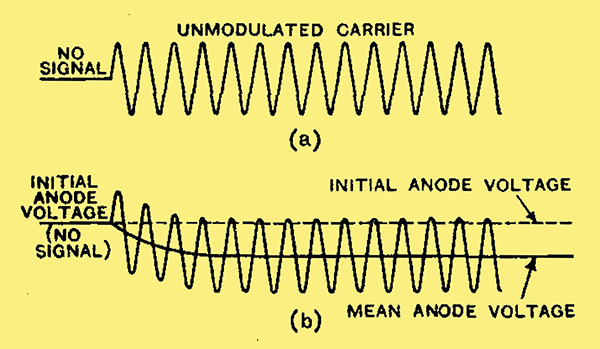
Fig. 3. - Carrier voltage applied to diode, and (dia. b) mean anode-voltage resulting. Note that the peaks of the high-frequency voltage run the anode a little more positive than its initial value, thus providing the current which drives the anode negative.
Reverting to the point A (R = 0.5 MΩ) let us imagine that there is applied to the anode an unmodulated high-frequency signal, of amplitude 1 V peak (Fig. 3a). The resulting excursions. in Ea, will cover the range C to D, leading to an anode current swing from E to F. Owing to the shape of the curve, the rise in current AF is very much larger than the fall AE which takes place on the other half-cycle; the average current, therefore, will rise. Flowing, as it must, through R, this increase in current will lead to an increase in voltage across R, so that the anode will become more negative. The second complete wave will repeat this process, swinging the voltage about the point reached at the end of the first, and driving the anode still more negative. If the signal continues at unchanged amplitude the anode will eventually settle down at a new equilibrium voltage, this being determined by the new value of average anode current flowing through R. In practice, this voltage will be such that the peaks of the received wave just run the anode into momentary current, no current flowing during the rest of the cycle. The change in anode voltage is depicted in Fig. 3b, below the high-frequency voltage that causes it.
Effect of Modulation
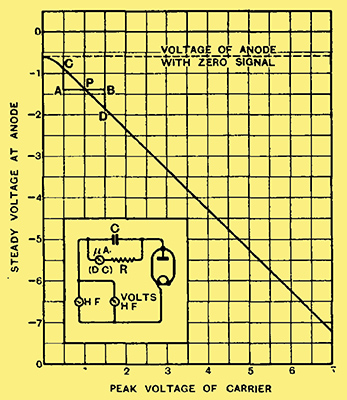
Fig. 4. - Typical rectification curve of diode, showing increasingly negative mean anode potential as the steady (unmodulated) high-frequency voltage rises.
If the amplitude of the signal is increased the anode will become more negative, so that it becomes possible to plot a curve such as that of Fig. 4 showing the relationship between the signal-voltage and the steady anode voltage resulting from it. The circuit used for constructing such a curve in the laboratory is shown inset. The derivation of this curve from that of Fig. 2, which obviously determines it, is theoretically possible, but involves rather laborious calculation. With the aid of this new curve, however constructed, the behaviour of the diode when receiving a modulated carrier can be completely elucidated.
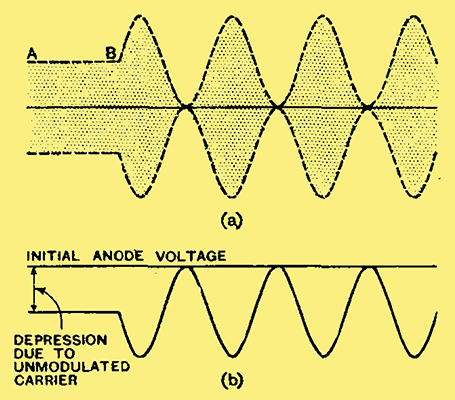
Fig. 5. - Diagram (a) represents a carrier modulated to 100%. Amplitude of HF voltage (individual cycles too fast to show) varies between zero and double the amplitude of the unmodulated carrier shown at AB. Corresponding fluctuations of anode voltage (of detecting diode) at audio frequency are shown in diagram (b).
The two things that we need to know about the received carrier-voltage are, first, its mean amplitude, and, second, the range over which this amplitude is varied by the modulation. For distortionless transmission the increase and decrease in carrier amplitude that correspond to positive and negative half-cycles of the modulating voltage must be equal. It is evident that the maximum possible decrease in carrier-amplitude is found when the modulation reduces the carrier so far that it just, and only just, ceases at the exact moment of minimum amplitude. At its maximum it will then rise to double its steady value, as shown in Fig. 5a. Any attempt to make the maximum higher than this will result in the carrier actually ceasing for an appreciable period at each minimum; over this interval the envelope of the carrier-amplitude can no longer represent the envelope of the modulating voltage, and there will be distortion.
When the carrier has its maximum swing, from zero to double its mean value, it is said to be modulated to a depth of 100%. In general, the maximum rise in amplitude, expressed as a percentage of the mean, is taken as the measure of modulation depth. Thus a rise from 1 Volt to 1.5 Volt corresponds to 50% modulation, a rise to 1.4 Volt to 40%, and so for other values. In transmitting a musical programme, variations in loudness of the received music are produced by variations in modulation-depth, these producing corresponding changes in the audio-frequency output from the detector.
Suppose that to the detector of which the curve is shown in Fig. 4 there is applied a carrier of 1 Volt mean amplitude, modulated to 50%. The high frequency voltage will then swing, at audio-frequency, over the range 0.5 to 1.5 Volts, that is, over the range AB. The voltage at the detector anode will then be driven over the range CD, rising by 0.47 V above and falling by 0.47 V below its mean value at P. The detector will thus furnish an audio-frequency voltage of this peak amplitude to operate the succeeding valve. Moreover, since the rise above the mean voltage is equal to the fall below it, this audio-voltage will be a faithful replica of the envelope of the carrier, and the process of detection will be distortionless.
But if the modulation of the carrier rises to 90%, distortion will be introduced; the rise will now be 0.76 V and the fall 0.88 V. This distortion of the received waveform is equivalent to the introduction of alien frequencies not present in the original wave, and leads (if sufficiently marked) to an unpleasant falsification of the music ultimately emitted by the loud speaker. It is therefore an effect to be scrupulously avoided if possible.
This distortion arises, as Fig. 4 makes evident, from the fact that the detector characteristic is curved over the range 0 to 0.4 Volt (signal). This curvature, extending over a larger or smaller distance, is characteristic of all thermionic rectifiers and cannot be completely avoided. In the present case, extending to 0.4 V, it permits distortionless rectification of a carrier only so long as the modulation does not swing it below this value. A carrier of 1 V amplitude can therefore be modulated to 60% without harm, but detector distortion arises it the modulation is deeper than this.
With a 4 Volt carrier the curved part only covers 10% of the range of variation, so permitting modulation to 90% before the distortion starts. Modulation of this depth is rarely exceeded, and then only momentarily, on any transmission, so that when supplied with a carrier of this amplitude the distortion introduced by the detector would not be serious. The exact modulation-depth at which distortion may be permitted to enter with reasonable safety is clearly not susceptible to precise specification, but most set designers would feel quite content with a detector that was distortionless up to 90% modulation.
It will be appreciated that the curve of Fig. 4 permits one to read off the audio-frequency voltage obtainable from a carrier of any amplitude modulated to any depth, but it must be borne in mind that, like the dynamic characteristic of a triode, the curve only applies to one particular combination of diode valve and resistance. Changing the resistance involves constructing a new curve though the differences are likely to be small so long as R is considerably higher than the AC resistance of the diode itself. After the initial curved portion, the characteristic will in any usual case show the development of little short of 1 Volt DC for every Volt (peak) of signal applied.
The main effect of varying the value of R over the usual ranges is to change the damping introduced into the tuned circuit. The rectified current through the valve increases as R diminishes, and since this current is derived from the signal voltages themselves power is abstracted from the tuned circuit. In practice one may reckon, as a close approximation, that the damping effect of a diode detector with a load resistance R is equivalent to connecting a resistance R/2 directly across the tuned circuit. The existence of this damping supplies the main reason why R is often allotted a value as high as 0.5 MΩ or considerably higher.
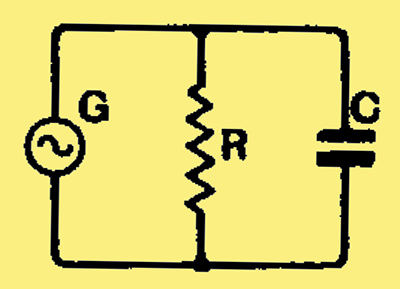
Fig. 6. - Simplified circuit of diode detector. C and R correspond to the capacity and resistance in Fig. 1d, while the generator G must be regarded as supplying a constant current for a given modulation depth, irrespective of the frequency of modulation.
The capacity chosen for the capacitor C is of some importance. It is included to provide a ready path by which the high-frequency signals can reach the anode of the valve. The audio-frequency voltage generated by detection appears across R. with which C is effectively in shunt, since the impedance of the tuned circuit to low-frequency currents is so small that we may neglect it. The circuit thus simplifies down to that of Fig. 6, in which an audio-frequency current, constant irrespective of frequency, passes through R and C in parallel, developing across this combination the voltage which is fed to the grid of the succeeding LF amplifier.
The total impedance Z presented by this combination is given by:
I/Z2 = 1/X2 + 1 / R2,
whence Z = RX/√(X2 + R2).
The voltage developed is:
I × Z = IR × X/√(X2 + R2).
It is clear that the fraction X/√(X2 + R2) will always be less than unity, but so long as X is much larger than R, only by a trifling amount. At the lower frequencies this condition will be fulfilled for any usual value of C, but at the higher audible frequencies X will drop. If the voltage is not to fall below 90% of that at lower frequencies, X/√(X2 + R2) must not fall below 0.9, which means that X must not fall below about 2R. To retain 90% of 5 kHz notes when R = 0.5 MΩ, C must not exceed the value given by 1/2πfC = 1 MΩ, from which we find that the maximum permissible value for C is 31.8 pF.
It is more usual, however, to employ a capacity of about three times this value.
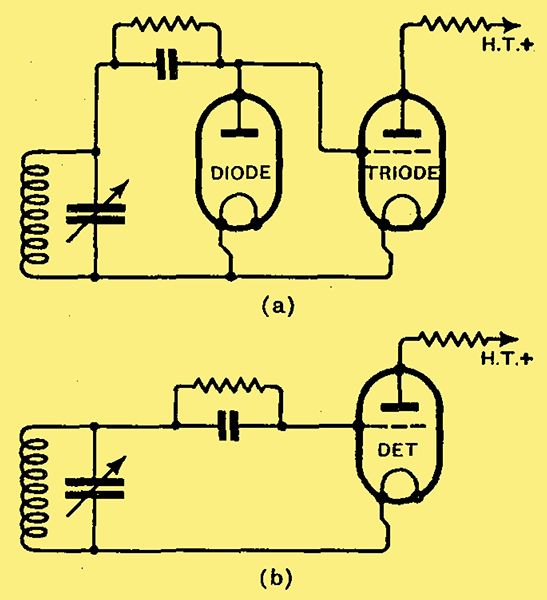
Fig. 7. - Skeleton diagram of diode detector followed by triode as amplifier of the detected signals. Compare this with a 'grid detector' (dia. b) in which cathode and grid behave as a diode detector, which acts as combined detector and amplifier.
The circuit of Fig. 7a shows a diode detector linked through to a triode used as amplifier for the low-frequency voltages produced by rectification at the diode. With this simple method of connection between the two valves the anode-cathode path of the diode is in parallel with the grid-cathode path of the triode. Since both the anode of the diode and the grid of the triode consist simply of an electrode in the immediate neighbourhood of an emitting cathode, there would seem to be no need to have them both present. Experiment confirms this supposition; there is no change in the performance of the system if the diode is removed from its socket.
The simplified circuit resulting is the well-known grid-detector of Fig. 7b, in which the grid and cathode, acting as a diode, rectify in the manner which we have discussed. The audio-frequency voltages appearing on the grid as a result of this then serve to control the electron-stream through the triode, and so produce an amplified LF voltage at the anode.
The faults in the circuit of Fig. 7b, and the manner in which the diode-triode circuit of Fig. 7a can be modified to overcome them will shortly be considered.
We now deal at length with anode-bend detection - from which, in spite of its obsolescence, many useful lessons may be learned - and also with the more practical question of the best operating conditions for grid detectors.
A triode can act simultaneously as detector and amplifier of incoming signals. In this use of the valve, detection takes place entirely between grid and cathode, these two electrodes behaving exactly like the diode detector. The modulation-frequency voltages produced on the grid in this manner then serve to control the anode current of the valve, producing across the anode-circuit load an amplified copy of themselves. The grid of the detector serves, in this simple view of the process, both as anode of a diode detector and as grid of a low-frequency amplifier.
In the diode, as in the crystal, detection arose out of the non-linearity of the characteristic, resulting in unequal changes of current in response to the two equal half-cycles of voltage applied. In these particular cases the current was actually driven by the signal-voltage, but the same principle would apply if the signal only controlled the current, provided that the current did not vary linearly with the controlling voltage.
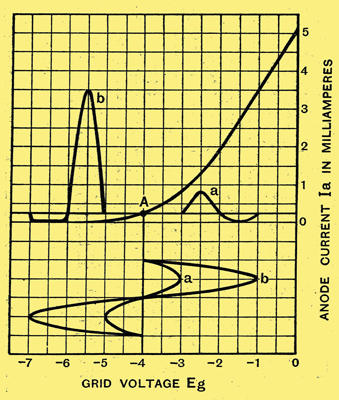
Fig. 8. - Illustrating rectification of both weak and strong signals by an anode-bend detector.
If we examine the valve curve of Fig. 8, in which anode current is plotted against grid-voltage (of a triode), we see again a non-linear characteristic. At currents over about 1.5 mA. the curve is nearly straight, so that rectification will not occur, but at lower currents it is very definitely curved. If, at the anode voltage to which the curve relates, we bias the valve to -4 Volts, We shall have an anode current of 0.25 mA. On applying an alternating voltage to the grid, as in Fig. 9, we shall swing the grid voltage rapidly to and fro about the point A as centre. On the positive half-cycle the anode current will rise largely, while on the negative half cycle it can do no more than drop to zero.
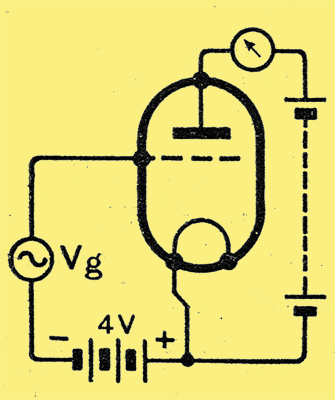
Fig. 9. - Circuit of the anode-bend detector to which the curves of Fig. 8 are related. Vg represents the HF voltages shown in the voltage (lower) curves a and b of that figure.
The lower curves a and, b in Fig. 8 show two sine wave voltages centred on -4 V, by tracing out the corresponding currents and plotting them we get two upper curves a and b. These represent the anode current, instant by instant, produced by the alternating, voltages V shown. In the current-curve b, corresponding to 3 V. peak on the grid, rectification is very evident indeed; the upper half-cycle is tall, indicating a large increase in current, while the lower half-cycle is very small. Rectification is thus very nearly perfect, since one half-wave is almost completely suppressed. It is evident that the mean anode current will rise some way above the initial 0.25 mA. and will remain at this increased value as long, as the alternating voltage is applied.
Partial Rectification
The current curve a, corresponding to the application of a smaller alternating voltage (1 V peak) to the grid, shows much less perfect rectification, as is indicated by the nearer approach to equality between the two half-cycles. The rise in anode current resulting from this smaller voltage will in consequence be very much less than one-third of that due to the larger voltage. But it is quite clear that in either case rectification takes place, and that if a modulated, high-frequency voltage were applied to the grid instead of the simple carrier-voltage of which one cycle is shown, telephones in the anode circuit of the valve would; reproduce as sound the programme modulating the carrier.
Rectification taking place, as here, by virtue of the bend in the anode-current curve is known as anode-bend, or, more colloquially, as bottom-bend rectification.
As in other cases of detection, we could plot change in anode current against amplitude of carrier applied to the valve. Since, however, we shall probably use a detector to supply the audio-frequency signal-voltage to a succeeding valve, it would be more profitable to plot, instead of change in anode current, the change in voltage produced across a coupling resistance in the anode circuit.
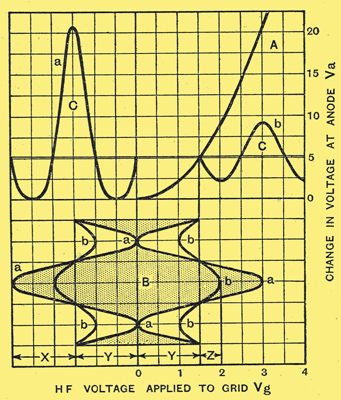
Fig. 10. - Summarising the process of anode-bend detection. A, rectification characteristic of anode-bend detector; B, modulated HF voltages applied to grid. C, anode-voltage swings corresponding to B; deduced directly from A. X, modulation rise 1.5 V, 100% modulation. Y, mean carrier amplitude, 1.5 V. Z, modulation rise, 0.5 V, 33.3% modulation.
In the curve A. of Fig. 10 this is done for a typical battery-heated triode with an anode resistance of 0.1 MΩ.
Unlike the corresponding curve for the diode rectifier, which, after a short initial curvature, was a straight line, this curve continues to grow steeper and steeper throughout its entire length. The relation between carrier voltage Vg and change in anode voltage Va is, in fact, such that Va is proportional to Vg2 - for which reason the detector is known as a square-law detector. The diode, on the other hand, is a linear detector. In connection with the latter the straightness in this curve is essential for distortionless rectification; here the point is clearly illustrated.
Below the curve at B are drawn two modulated carrier waves; both of mean amplitude 1.5 Volt. One (shaded) is modulated to a depth of 100% and is designated a; the other, b; is unshaded and is modulated to 33% only. The curves of anode voltage corresponding to these, deduced by picking out from the curve the individual voltages corresponding to a number of the different carrier-amplitudes indicated by the envelope of the modulated wave, are drawn at C on the diagram.
Output curve a, derived from the deeply modulated carrier, is a most unfaithful reproduction of the wave-form of the original carrier-envelope. Since the carrier-amplitude, centred round 1.5 V, is sWinging with the modulation between zero and 3 V, and the curve shows that the corresponding changes in Va are. from an initial 5 V down to zero and up to 20 V the source of the inequality is not far to seek. It is simply due to the non-linearity of the Va -Vg characteristic. This results in a kind of double rectification, the audio-frequency output produced by rectification of the carrier being itself partially rectified.
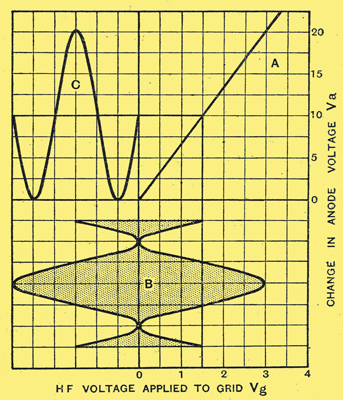
Fig. 11. - The curves of Fig. 10, now drawn for a purely fictitious linear detector. Note complete absence of distortion shown by output curve C.
As a comparison; Fig. 11 shows, to the same scales as Fig. 10, the curve of a purely imaginary detector of absolutely linear characteristic, together with the audio-frequency output it would give if supplied with a carrier of mean amplitude 1.5V. modulated to at depth of 100% Here the final output is an exact facsimile of the envelope of the received carrier; the detector is thus completely dstortionless.
From the practical point of view the conclusion to be drawn from these curves is that considerable distortion, far more than enough to be audible in the loud speaker as a falsification of the music, results when a square-law detector is used to detect a deeply modulated carrier.
Effect of Modulation
With less deep modulation, as in the voltage and current curves b of Fig. 8, this distortion of the audio-frequency output from the detector is much less marked. It is still present, but at 33% modulation the range over which the carrier-voltage is swung by the modulation is so much shortened that the corresponding section of the curve A approaches more nearly to a straight liner. At low values of modulation, round about 15%, the distortion becomes unnoticeably small.
In spite of this very serious failing, anode-bend detectors are quite often used in receiving sets, apparently with reasonable success from the point of view of quality of reproduction. This is understandable when one remembers that the transmitter sends out the bulk of its music at quite moderate modulation (probably round, about 15%, reserving deep modulation, approaching 100%, for an occasional crashing fortissimo. Nevertheless, the inherent tendency to distortion of the anode-bend rectifier is leading to its disappearance from receivers of modern design, in spite of the advantage it offers in that, not taking current at its grid, it imposes no grid-current damping upon the tuned circuit from which it derives its signal.
The process of anode-bend detection has been discussed at some length in spite of its obsolescence, partly because it illustrates several interesting points in connection with detector action and detector distortion, and partly because the possibility of detection of this type limits rather seriously the performance of a valve used as a grid detector.
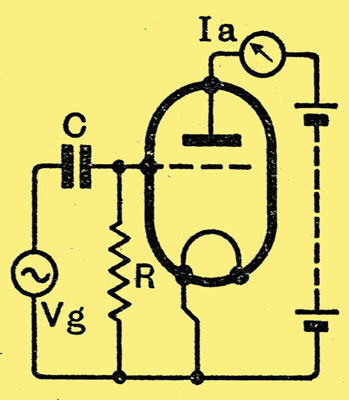
Fig. 12. - Conventional arrangement of triode as grid detector. Note that since R has to carry steady and audio-frequency currents only, it is immaterial whether it is connected as shown here or in parallel with C.
In the circuit of Fig. 12 we see a triode arranged as a grid detector. On receipt of an unmodulated carrier the grid, initially at or near zero potential, will run negative to an extent approximately equal to the peak voltage of the signal applied. This change is shown accomplished at a in Fig. 13, where the carrier is shown as having a peak amplitude of 1 Volt In sympathy with this shift of mean grid voltage, the anode current of the valve will suffer a reduction; on the curve E = 60 at the top of Fig. 13 we see that Ia drops from 4.9 to 3.1 mA.
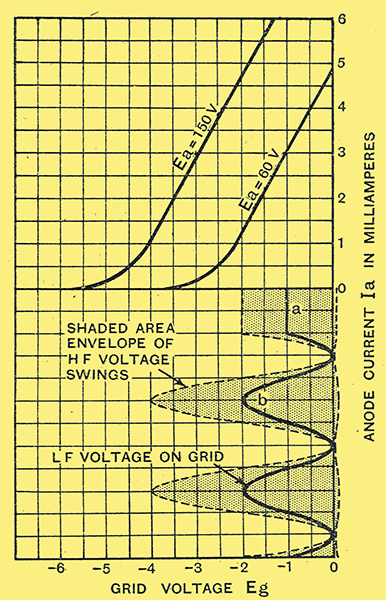
Fig. 13. - Curves showing reason for overload of grid detector. A. Even though the rectified voltage b on the grid may not overrun the straight part of the characteristic, the HF voltage accompanying it may cause anode-bend detection.
If now the high-frequency voltage is modulated to a depth of 100%, which means that the carrier-amplitude is alternately doubled and reduced to zero by successive half-cycles of the (LF) modulating voltage, the grid will swing between its original no-signal voltage and -2 Volts, as shown by the full-line curve at b in Fig. 13. This swing will take place at modulation frequency, and represents the result of the process of detection by the grid acting as diode.
From the anode-current curve corresponding to Ea = 60 V. We see that this audio-frequency. voltage developed on the grid will cause an audio-frequency current swing from 1.25 to 4.9 Volts. Since the valve-curve is a straight line over this range, the wave-form of the current might be expected to be a strict duplicate of the audio frequency grid voltage. Unfortunately it is not, on account of the presence on the grid of the high-frequency carrier-voltage, which is shown on Fig. 13 as a shaded area enclosed by a dotted line. The high-frequency voltage swings the grid to -4 V, thereby running the anode current as read from the curve Ea = 60 over the curved part of the characteristic and down to zero. Over this region, as we have already seen, anode-bend rectification will take place, raising the anode current above the value it would have had in the absence of the HF voltage. Since this rise takes place at the moment when the detected LF voltage on the grid is trying to send the anode current down, the result is flattening of the peak of this part of the audio-cycle. Again we have met our old enemy distortion.
The cure for this trouble is quite simple, and consists in keeping down the voltage of the applied signal to so low a value that the high-frequency ripple on the grid never drives the anode current down, even momentarily, to so low a value that the non-linear part of the valve characteristic is entered upon. This means that the low-frequency output voltage from the anode must be kept down to a maximum of one-half of that which could be obtained if the HF voltage were absent and the valve were acting purely as low-frequency amplifier.
This is the condition in which an ordinary grid-detector is made-to work, and its performance when used in this way is very reasonably satisfactory. But owing to the low voltages being handled at the grid, the initial curvature of the rectification curve will introduce some distortion on deeply modulated signals. This can only be minimised, as we have seen, by supplying a larger voltage for detection.
This can be done if we increase the anode voltage of the grid detector to perhaps 150 V, when the anode current at all grid voltages will be raised, so that the grid must be made more negative before the curved portion of the characteristic is reached. This is shown by the curve Ea = 150 of Fig. 13, and comparison of this with the grid-voltage curve below it will show that even at the moments when the high-frequency voltage is at its maximum the straight part of the curve is not departed from. So handled, the detector is known as the 'power grid detector'; it has the disadvantage of a high anode current, but is otherwise admirable. It has had a considerable vogue in the past, but is now falling to some extent into disuse, for the reason that when there are available such large signal-voltages as its use implies, the diode detector is generally preferred.
From what has been said, it will be evident that the propensity to overload characteristic of , the grid detector is due entirely to the need to accommodate large high-frequency current swings in the anode circuit. Since detection takes place on the grid of the valve, we have no use for high-frequency current at the anode; we are really trying, rather ineffectively, to use the valve as an amplifier of the rectified audio-frequency voltages only.
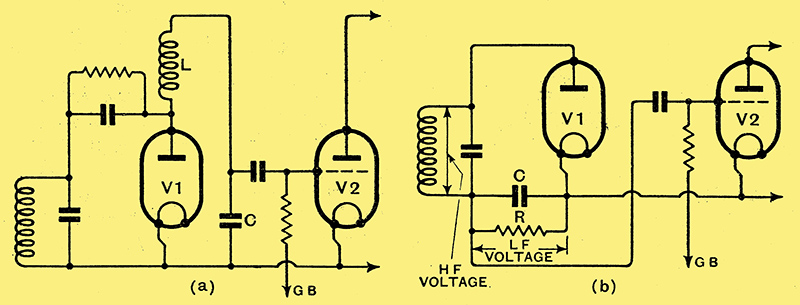
Fig. 14. - Detection by diode - V1 followed by pure LF amplification by the triode V2. Two methods of keeping HF voltages from the grid of V2 and so stopping overload: (a) By interposing the filter composed of L and C. (b) By picking up the audio-frequency for V2 from a point X where HF voltages are practically non-existent.
By using a diode for the actual detection and so connecting it to a succeeding triode that then audio-frequency voltages only are passed to its grid, we can at one blow remove the need for making the triode amplify these troublesome HF voltages, and. so free it completely from any danger of overloading other than that due to a possible excess of low-frequency signals. Two circuits for this purpose are shown in Fig. 14, at a the separation of the two currents is performed by interposing a filter, consisting of a high-frequency choke L and a capacitor C, these components being so dimensioned that L has a much higher, and C a much lower, reactance to high-frequency currents than to those of low frequency. Alternatively, we can adopt the circuit shown at b, where the capacitor and resistance associated with detection are placed at the lower end of the tuned circuit. In this case, as the diagram suggests, the grid of the triode is connected to a point where there exists the full audio-frequency voltage developed across R, while the high-frequency voltage is only that across C, and is negligible compared with that across the tuned circuit.
Either of these circuits provides a detector-amplifier system free from all the disadvantages attendant upon making a single triode, whether as anode-bend or as grid detector, perform both functions simultaneously.
|