|
My mother passed away in 2004 and left me a small amount of money. I wanted to buy something I would see most days and the Tektronix TDS 2012 dual trace oscilloscope was my choice. Great 'scope and the FFT display has proved useful in a qualitative way. Wanting to measure THD on an amplifier project I went looking for guidance and found the video referenced above.
I had been measuring amplifier performance by adjusting the output across the dummy load until a slight increase in amplitude started to show an increase in the 3rd harmonic of the input 1 kHz sine wave. This I was content showed the undistorted output available. Obviously less than the figures given by designers or manufacturers who specify the output in terms of the just objectionable level of distortion - say 3 W at 10% THD. Testing the Chinese mini 6P14 (EL84) push pull amplifier the output for a DC input per channel of 14 W was only 1.5 W. Was something wrong with the test set-up? (no there was not).
Looking at test equipment and reviews led me to sound-cards and software, low cost and high cost equipment and finally to the maths and the video.
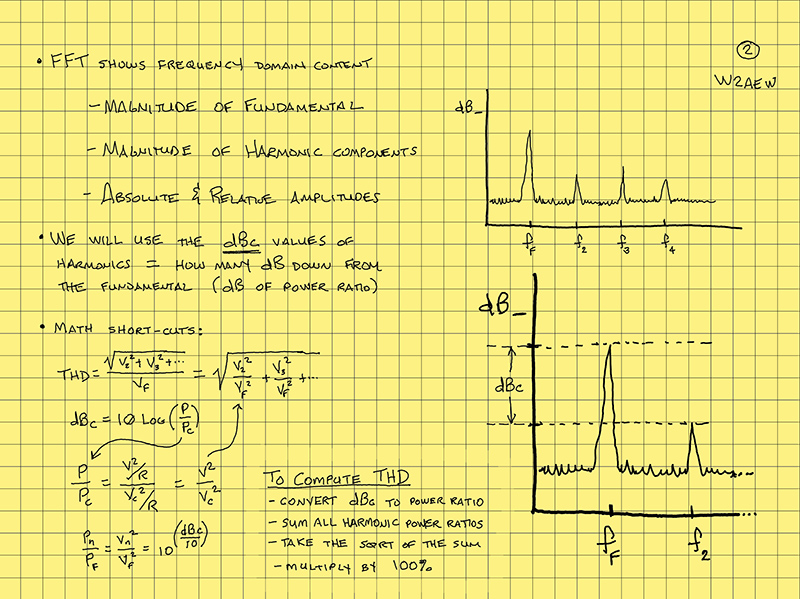
I confess to having been ignorant of dBc and the connection with THD. The tutorial set me straight and I present the written summary below.
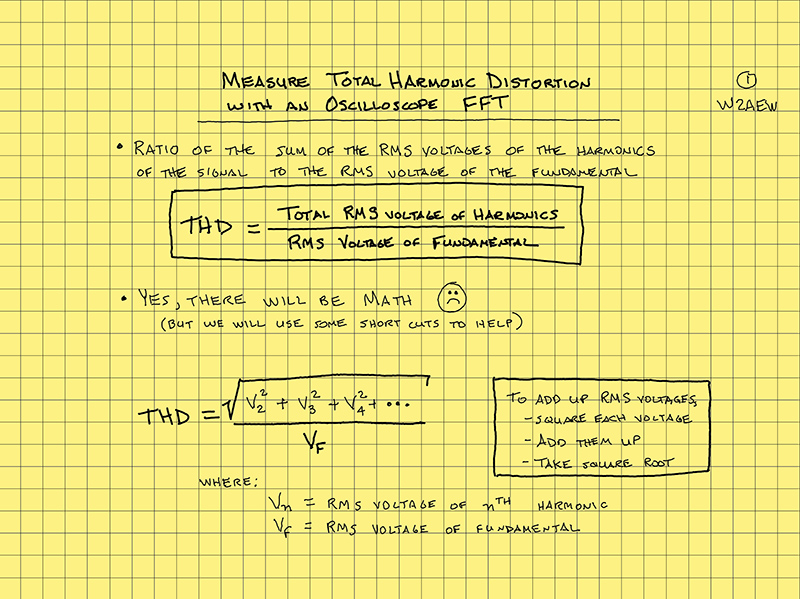
Notes from W2AEW's tutorial.
The cursors on the TDS 2012 can be set to the maximum of the fundamental and sequentially to the displayed harmonics. For the professionally built vintage Mullard 3-3 amplifier the results were as follows.
Power in Watts = RMS voltage across the load squared divided by the load resistance. rearranging to find the RMS voltage to set V = SQRT(W x R), for three Watts this comes to an RMS sine wave of 3.46 Volts.
On the FFT display with the cursors in place the difference in power (dBc) was 2nd harmonic -24, 3rd harmonic -26 and fourth harmonic -42 dBc. The latter being below 30 dB below the fundamental will contribute very little to the final result.
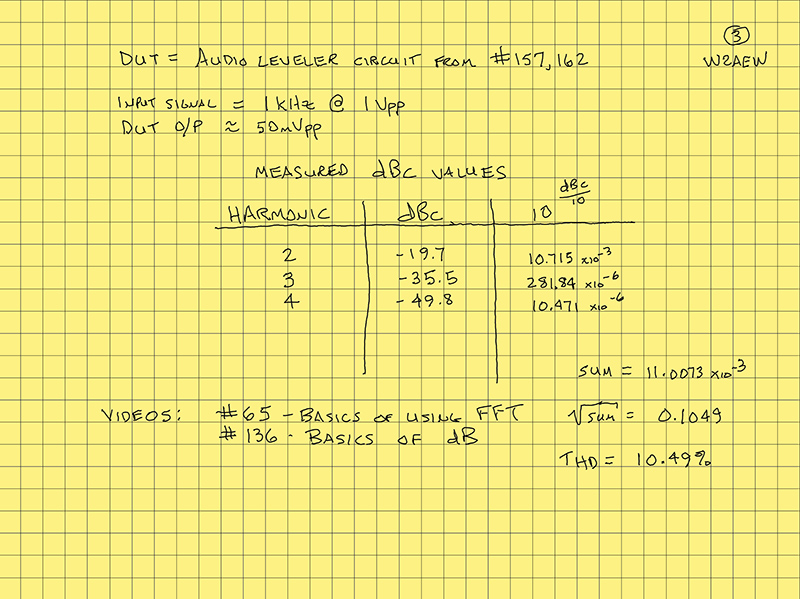
From the formulae on the third page a spreadsheet was constructed and the measurements entered. The figure so obtained as a THD of 8%, better than the original specification. But as a cathode biased amplifier driven with a continuous sine wave will indicate 10% down on the instantaneous power available during music transients, the power measured will be slightly less than 3 Watts. The function generator output was 180 mV RMS and the amplifier should have needed no more than 100 mV for full output. Still not a bad result from a few minutes work.
|