|
Effects of Ear Distortion and Masking
In this article the smallest amount of non-linear distortion that can be detected by ear is calculated from known non-linear hearing effects. The result is compared with the directly measured value. The method of calculation is to determine the extent to which non-linear hearing effects produced by the fundamentals will hide any distortion products which may also be present.
This concealment may occur in two ways. In the first place the usual spurious frequencies produced by non-linearity are produced in hearing. Secondly, the fundamental raises the hearing threshold level for other frequencies where distortion products may be present. The original threshold level, and the extent to which this level is raised by noise present even in very quiet surroundings must also be taken into account. When the hearing of one frequency raises the threshold level for another, the latter frequency is said to be 'masked'.
Masking Effects: Harmonic Distortion
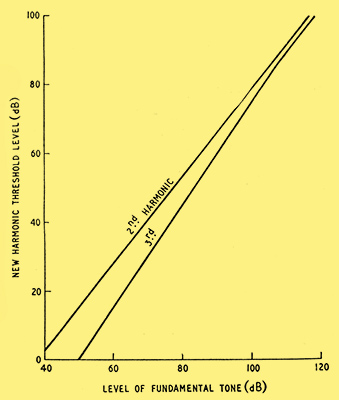
Fig. 1. Change in threshold level produced by fundamentals between 400 and 4,000 Hz.
It is convenient to consider threshold level effects first. The various results obtained for the increase in the threshold level produced by a given frequency may be summarized approximately as in Fig. 1 for fundamental frequencies between 400 and 4000 Hz (0 dB corresponds to the standard sound pressure of 2 x 10⁻⁴ dynes/cm2)definition at bottom of page. It is necessary to consider also the increase in the threshold level caused by harmonics produced in hearing. However, from results on the level of these harmonics given later, it can be shown that for second and third harmonics the level is raised less due to harmonics produced in hearing than due to the fundamental. (This may not be the case for the higher harmonics, particularly at high fundamental levels.)
It is necessary to know also the practical threshold level in the absence of any applied sound. This is given in Fig. 2 for a person with very acute hearing, in a very quiet residence (total noise level only 33 dB). [1] Radio Designers Handbook by F Langford-Smith, 4th Edn., p. 621. Iliffe and Sons, Ltd. From curves given by the Jensen Mfg Co. The increase in the threshold level produced by the masking action of the noise which still remains even in these circumstances is also illustrated in Fig. 2. For frequencies between 400 and 10,000 Hz the threshold level is between 10 and 20 dB.
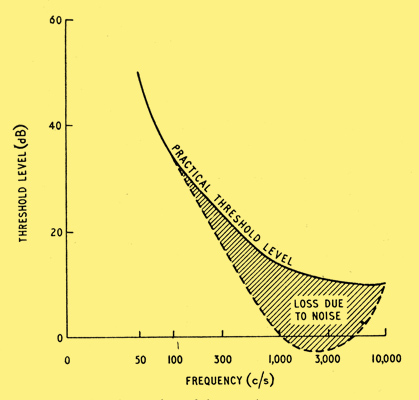
Fig. 2. Threshold level for acute listener in low noise residence.
From data given by Sivian and White [2] J Acous. Soc. Amer., Vol. 4, p. 288, 1933. the threshold level in the absence of noise is ~10 dB lower for binaural listening. However, because of the masking effect due to noise (illustrated in Fig. 2) the practical threshold level of Fig. 2 will also apply to binaural listening for frequencies above 100 Hz. Below 50 Hz the results of Ref. 2 indicate that this effect of binaural listening disappears.
Any harmonic distortion present in the applied signal will not be detected unless it is above the actual threshold level under the conditions of detection. For this threshold level we must take the raised level produced by the fundamental (given in Fig. 1), or the original level (given in Fig. 2), whichever is the greater. Considering threshold level effects only, we thus obtain the minimum level of harmonic distortion which can be detected. By comparing this with the fundamental level, the smallest detectable percentage distortion is obtained. For example, at a fundamental level of 60 dB the raised threshold level for the second harmonic is 28 dB, from Fig. 1. This is greater than the initial threshold level of 10 dB. The smallest detectable second harmonic distortion at a fundamental level of 60 dB is thus 60-28=32 dB down on the fundamental. This corresponds to a distortion voltage of (antilog101.6)-1 of the fundamental, ie 1/40 of the fundamental, ie 2.5%. The complete results are shown in Fig. 3 for both 10- and 20-dB no-signal threshold levels.
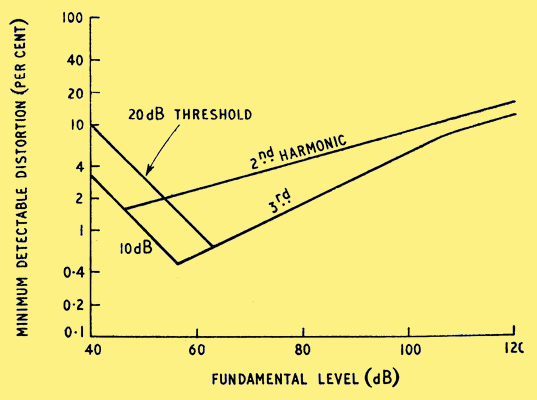
Fig. 3. Smallest detectable distortion (considering threshold level masking) for fundamentals between 400 and 4000 Hz.
At frequencies lower than 800 Hz the smallest detectable distortion will increase for two reasons. In the first place, from Fig. 2 the initial threshold level is higher at such frequencies. When this higher threshold level is used in Fig. 3 the smallest detectable distortion is increased. Secondly, the few available data on the masking produced by low frequencies indicate that this is also greater.
For masking frequencies above 4000 Hz the few available data indicate a decrease in the masking. However, the threshold level in the absence of any applied sound increases above 10,000 Hz (which is the second harmonic of 5000 Hz). Thus it is not clear what will happen to the smallest detectable distortion. In any case the harmonics will pass outside the audible range for fundamental frequencies greater than about 8000 Hz.
Relation Between Harmonic and Inter-modulation Distortion
To extend this analysis to inter-modulation distortion it is necessary to discuss the relation between such distortion and harmonic distortion, following Warren and Hewlett. [3] Proc. IRE, V01. 36, p. 457, 1948. Supposing for simplicity that the distorted transfer characteristic has only square and cube-law distortion terms, we may put e0 = a1ein + a2ein2 + a3ein3, where ein, e0 are the sine wave input and output voltages respectively, and a1, a2, a3 constants. a2ein2 and a3ein2 are the square and cube-law distortion terms respectively. Considering only two inter-modulating sine wave signals we can write ein = Asin(a)±sin(b). Evaluating e0 we find
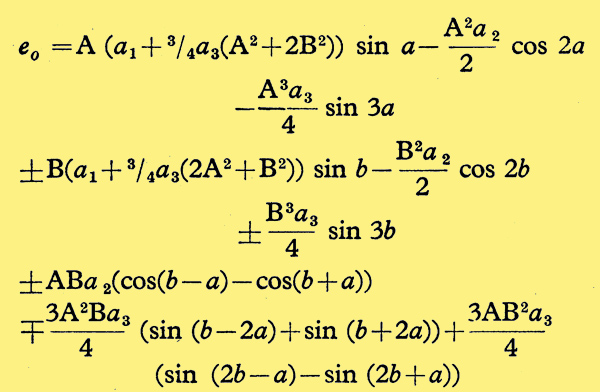
Considering harmonic distortion, in this simple case the square-law distortion term gives rise only to second harmonic distortion, and the cube-law term only to third harmonic distortion. Considering inter-modulation distortion the square-law distortion term gives rise to inter-modulation products of frequencies f1±f2 only, and the cube-law term to frequencies 2f1±f2, f1±f2 only, where f1, f2 are the input frequencies (a=2πf1t, b=2πf2t).
The analysis is simplified if we confine it to cases where only one type of distortion (square or cube-law) is present. This is not in practice a great restriction. Square and cube-law distortion alone occur to a fair approximation in single-ended and push-pull amplifiers respectively. Using the subscripts h, i for the particular values of A, B when considering harmonic or inter-modulation distortion respectively the harmonic distortion fraction of the fundamental divided by the inter-modulation distortion voltage at any one frequency is equal to
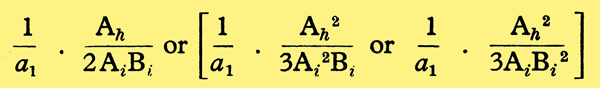
considering square or cube-law distortion alone respectively. (This assumes that 3/4a3(A2 + 2B2) and 3/4a3 (2A2 + B2) can be neglected in terms of a1. This will usually be possible in practice.) The relative magnitudes of different types of distortion will be significant if the same peak input voltage is applied in each case, ie if Ah = Ai +Bi. Thus, for equivalent distortions, the harmonic distortion fraction of the fundamental divided by the inter-modulation distortion voltage at any one frequency is equal to
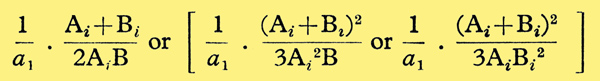
considering square or cube-law distortion alone respectively.
From this particular analysis we can convert inter-modulation distortion data to harmonic distortion data and vice versa. Distortion figures for audio systems and the smallest detectable distortion have generally been given in terms of harmonic distortion, even if it is the equivalent inter-modulation distortion that is fundamentally concerned. Moreover we are considering inter-modulation arising practically. In this case the inter-modulating frequencies and amplitudes may not be the standards for inter-modulation distortion measurement. Thus we shall continue to refer to the equivalent harmonic distortion even though we will be concerned with the inter-modulation frequencies produced at the same time by non-linearity.
Masking Effects: Inter-modulation Addition Frequencies
We can now return to the smallest detectable inter-modulation distortion. Considering only square and cube-law distortion, the addition frequencies arising in inter-modulation distortion (f1 + f2, 2f1 + f2, f1 + 2f2) lie between one and three times the higher fundamental frequency. Now the masking decreases fairly uniformly between one and three times the masking frequency. Thus the method used to obtain the results of Fig. 3 can also be applied to the addition frequencies arising in inter-modulation distortion. In cases where a difference frequency lies between one and three times one of the fundamental frequencies the same reasoning will also apply. The amount the threshold level is raised in these circumstances will depend both on the ratios of the inter-modulation product frequency to both fundamental masking frequencies, and on the amplitudes of these fundamental frequencies. Thus there are too many variables to allow calculation of the results in a simple form.
Certain facts however suggest the conditions under which the smallest detectable addition inter-modulation distortion is a minimum. Suppose that, due to masking, the threshold voltage level at an addition frequency becomes Ta. The smallest detectable inter-modulation level is then Ta or T0, the threshold voltage level, whichever is the greater. The smallest detectable equivalent harmonic fraction is thus
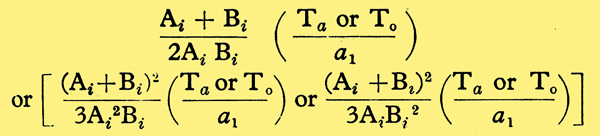
considering square or cube-law distortion alone respectively.
A simple first approach to determine the conditions under which these values are a minimum is to minimize either the functions of Ai and Bi, or Ta, separately. For a given (Ai + Bi), Ta is a minimum when f2 is as large as possible compared with f1, and Bi small compared with Ai. f1then produces little masking at the addition frequency due to the large frequency difference between the two. f2 is so small that it also produces little masking even at the comparatively near addition frequency. Alternatively, for a given (Ai + Bi),
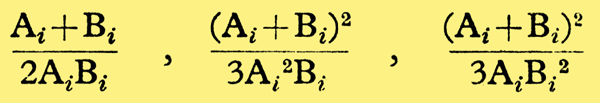
are a minimum when Bi = Ai, Ai/2, 2Ai respectively. The minimum values are then 1/Ai, 3/2Ai, 3/4Ai respectively. In these last cases Ta is also a minimum in practice when f2 ≈ f1.
Approximate calculations suggest that the smallest detectable equivalent harmonic distortion fraction is less if we minimize the functions of Ai and Bi and take f2 ≈ f1, than if we minimize Ta alone. At some levels (which depend on the type of distortion) the difference can amount to a factor of 2 or 3 to 1 for square and cube-law distortion respectively.
Using these relations between Bi and Ai and the condition f2 ≈ f1, the smallest detectable harmonic distortion fraction is
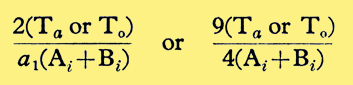
for square and cube-law distortion respectively. The masked addition frequency is twice and three times the fundamental respectively. Considering the addition frequencies arising in inter-modulation distortion the smallest detectable equivalent harmonic distortion is then 2 and 9/4 times the values given in Fig. 3 for square (2nd harmonic) and cube-law (3rd harmonic) distortion alone respectively.
The ratios used above are not the same as those usually quoted for measured inter-modulation to harmonic distortion percentages (3.2 and 3.8 for second and third harmonic alone respectively3). This difference will appear again in the complete analysis. It arises for several reasons. In the first place we are concerned with detection at one frequency at a time rather than addition over all distortion frequencies. The fundamental amplitude ratios we have considered are also not those standard for inter-modulation distortion measurement. Finally, additional complications can arise in actual hearing.
Hearing Distortion Effects: inter-modulation Difference Frequencies
Masking decreases rapidly if the masked frequency is reduced below the masking frequency. At any frequency below about 0.7 of the masking frequency the increase in the threshold level is much less than the values considered previously (given in Fig. 1). The masking is also much less than that given in Fig. 1 at frequencies many times the masking frequency.
For fundamental frequency ratios between 1/1.7 and 1.7 or 1/2.7 and 2.7 for the square-law or one of the cube-law distortion difference frequencies respectively, these difference frequencies are less than 0.7 of either of the fundamental frequencies. In some other cases a difference frequency arising in inter-modulation distortion may be many times one of the fundamental frequencies, and less than 0.7 times the other.
In these cases then, the masking at the difference frequency due to either fundamental is very much less than the masking considered previously. In evaluating the smallest detectable distortion for such difference frequencies, the inter-modulation produced in hearing becomes more important.
The harmonics produced in hearing were measured by Fletcher [4] J Acous. Soc. Amer., Vol. 1, p. 311, 1930. The results are reproduced in Hearing: Its Psychology and Physiology by S S Stevens and H Davis. John Wiley and Sons, and Chapman and Hall. and the results are given in Fig. 4.
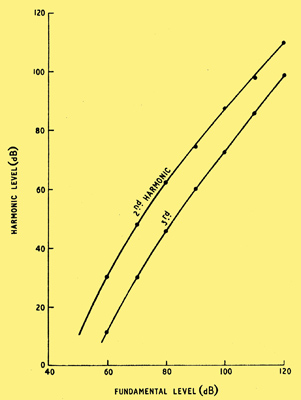
Fig. 4. Level of harmonics produced in hearing
In this figure the harmonic levels correspond to the absolute external sound levels which at the same frequency produce equal sensation levels to those of the harmonics produced in hearing. Fletcher reported that these results were independent of frequency. They agree with some measurements made at 650 and 900 Hz by Moe [5] J Acous. Soc. Amer., Vol. 14, p. 159, 1942. and with second harmonic distortion measurements made at various frequencies by Lawrence and Yantis [6] J Acous. Soc. Amer., Vol. 28, p. 852, 1956., or at a single frequency by Egan and Klumpf [7] J Acous. Soc. Amer., Vol. 23, p. 275, 1951., or Bikisy [8] Ann. d. Physik, Vol. 20, p. 809, 1934..
The paper by Egan and Klumpf suggests that the method of 'best beats', which has been used to measure harmonic levels by all the authors cited, gives too high a value for these levels. This error is due to masking by the fundamental, and becomes considerable when the harmonic level is near the masked threshold level. This happens with the second harmonic at low levels, and with the third harmonic at all levels. Furthermore, no measurement of a harmonic level by this method should ever give a value lower than the masked threshold level. However, results on the levels of the cube-law distortion difference frequencies obtained by Moe [5] J Acous. Soc. Amer., Vol. 14, p. 159, 1942. do not seem to depend at all on whether these difference frequencies are above or below the fundamentals, although a similar error should occur only in the former case. Moreover, Moe measured levels of addition frequencies which are well below the masked threshold level which would be expected.
These harmonic distortion data can be converted into inter-modulation distortion data by Warrens method of analysis considered earlier. This method assumes that hearing may be considered as a unity for all frequencies. However, the exact parts of the ear used in hearing are not the same for all frequencies. Thus there may be less interaction between different frequencies in hearing than is suggested by the distortion produced at one frequency. In this case the inter-modulation produced in hearing would be less than Warrens type of analysis would suggest. However, if this effect occurs we should expect the interaction to increase to the value given by Warrens analysis if the interacting frequencies are brought close together. Thus the smallest detectable distortion may be less than the value to be calculated using Warrens method; though with the fairly close frequencies we are considering (of ratios less than 2.7 to 1) the disagreement should not be large. The measured levels of the difference frequencies produced in hearing by fundamentals of 690 and 950 Hz (ratio 1.37 to 1) obtained by Moe [5] J Acous. Soc. Amer., Vol. 14, p. 159, 1942. do agree with those to be expected on this analysis from the harmonic levels also measured; although the corresponding addition inter-modulation frequencies appear to be about 10 dB lower.
Fletcher [9] Speech and Hearing, p. 149. D. Van Nostrand Co. also gives data on the smallest noticeable sound-level change at various levels and frequencies.
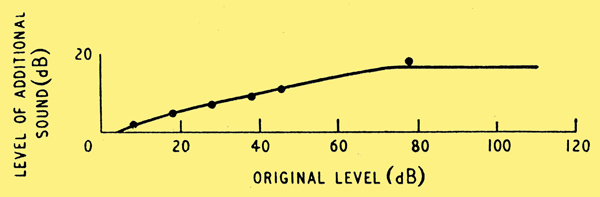
Fig. 5. Level of additional sound (in dB below the original level) to give a just noticeable change for frequencies between 500 and 8000 Hz.
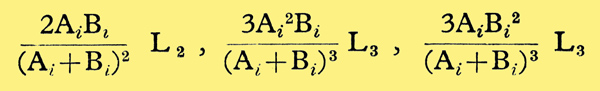
The results for any frequency between 500 and 8000 Hz are very similar and are presented in Fig. 5. From the level of the inter-modulation produced in hearing the smallest external inter-modulation level which will produce a noticeable change can be found from these data. If the second and third harmonic voltage levels produced in hearing are L2, L3 the corresponding inter-modulation levels are
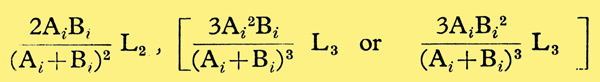
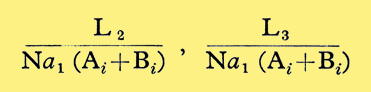
The smallest noticeable external inter-modulation level will be some fraction 1/N of these (given from Fig. 5), or the threshold level T0, whichever is greater. From Fig. 5, N is a maximum (and thus the smallest noticeable distortion a minimum) when the hearing distortion-level is a maximum. For a given Ai + Bi, (and thus L2, L3),
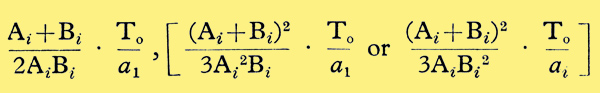
are a maximum when Bi = Ai, Ai/2, 2Ai respectively. (Equivalent conditions arose in the discussion of addition inter-modulation distortion.) The equivalent just noticeable second and third harmonic fractions are then
for square and cube-law distortion only respectively. This is provided that the just noticeable inter-modulation level is not below the threshold level. If it is below the threshold level the equivalent just noticeable second and third harmonic fractions are
respectively. For a given (Ai + Bi) these fractions have minimum values (as above) when Bi = Ai, Ai/2, 2Ai, respectively. The minimum values for the equivalent just noticeable second and third harmonic fractions are then
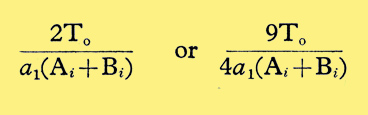
These various equivalent just noticeable harmonic fractions are plotted in Fig. 6 as percentages. Fig. 6 thus gives the smallest detectable distortion considering the inter-modulation produced in hearing. It applies to the detection of difference frequencies arising in inter-modulation between fundamentals of certain frequency ratios which have been evaluated above.
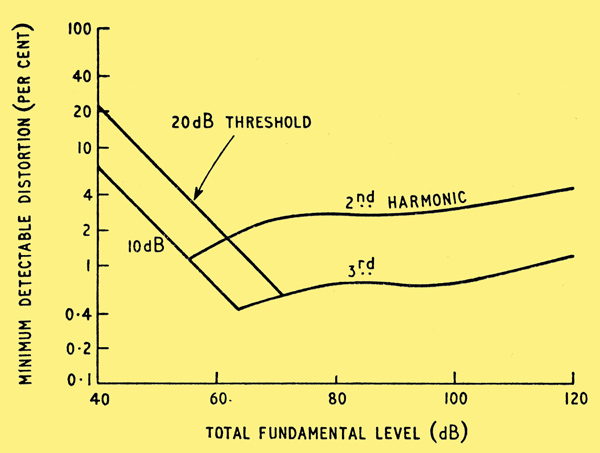
Fig. 6. Smallest detectable distortion (considering inter-modulation produced in hearing) for distortion frequencies between 500 and 8000 Hz.
At low frequencies the smallest detectable distortion is again greater, both due to the increased threshold level as before, and also because the smallest noticeable sound level change is greater. Data on the smallest noticeable sound level change at 50 Hz (from Ref. 9) are given in Fig. 7.
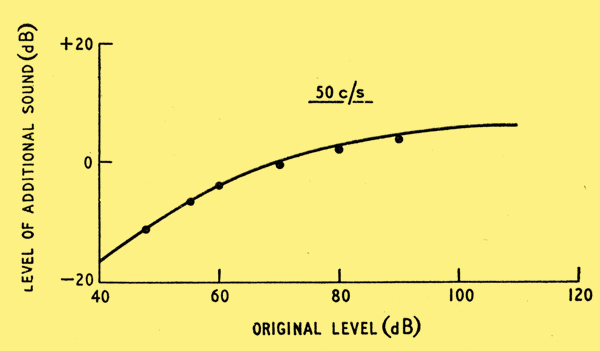
Fig. 7. Level of additional sound (in dB below the original level) to give a just noticeable change at 50 Hz.
Taking the threshold level at 50 Hz as 50 dB from Fig. 2 the smallest detectable equivalent percentage harmonic distortion is given in Fig. 8 by the same method as before. An important point is that from the method of calculation this smallest detectable distortion applies to distortion frequencies of 50 Hz. This corresponds, for example, to inter-modulation between 60 and 110 Hz.
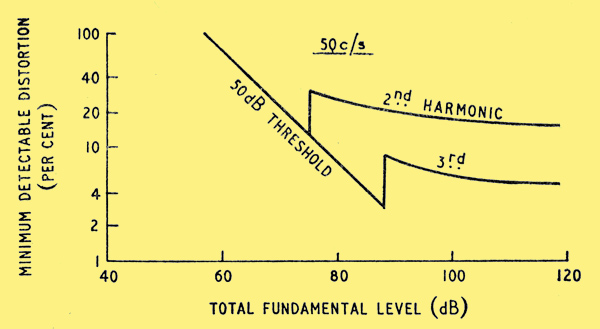
Fig. 8. Smallest detectable distortion (considering inter-modulation produced in hearing) for distortion frequency of 50 Hz.
Each distortion curve in Fig. 8 has a peculiar 'kink' in it. This arises because the just noticeable energy change at 50 Hz alters suddenly at the threshold level. From Fig. 7 it can be seen that at low levels slightly above threshold the additional sound to give a just noticeable energy change is considerably greater than the original sound. However, if the original signal is below the threshold level presumably as usual any additional sound above the threshold level will be noticeable. Thus, for signals just below the threshold level the additional sound to give a just noticeable change is only slightly greater than the original sound.
Random Uncertainty of These Results
The various results on masking summarized in Fig. 1, and the harmonic distortion measurements of Lawrence and Yantis [6] J Acous. Soc. Amer., Vol. 28, p. 852, 1956., show a spread of up to about ±10 dB about their mean. Thus our various results on the smallest detectable percentage distortion may in particular cases be in error by up to a factor of about 3.
Optimum Conditions for Distortion Detection
From our results the ear appears to be most sensitive to difference inter-modulation distortion produced by roughly equal fundamental frequencies, next most sensitive to harmonic distortion; and least sensitive to addition inter-modulation distortion. For all types of distortion the maximum sensitivity occurs at fundamental levels of about 50 to 70 dB. Inter-modulation distortion of all types is best detected at particular ratios of fundamental frequencies and powers which are near to unity. The standard conditions for the measurement of inter-modulation distortion, on the other hand, involve considerably different frequencies and powers.
Practical Results on the Smallest Detectable Distortion
For music Olson [10] Elements of Acoustical Engineering, p. 488. D. Van Nostrand Co. obtained a figure of about 0.7% total harmonic distortion for mainly second, and for both second and third harmonic distortion. The noise level was stated to be 25 dB and the peak electrical power 3 Watts. Assuming a normal acoustic efficiency of 3% this peak power would produce sound levels of about 90 dB in a normal living room as used by Olson. This author also states [11] Radio and TV News, Vol. 44, p. 60, 1950. that the ear is most sensitive to distortion for sound levels of 70 to 80 dB. Brittain [12] Wireless World, Vol. 59, p. 2, 1953. was able to detect 0.4% total harmonic distortion, no levels being stated. For sine waves at 1000 Hz and second harmonic distortion Braunmuhl and Weber [13] Akust. Zeit., Vol. 2, p. 135, 1937. give 0.7%; using two tones they obtained 1.3, 0.7 and 0.5% for frequency ratios of 1.05, 1.12 and 1.50 to 1 (lower frequency fixed at 800 Hz) respectively. On the other hand, these authors [13] Akust. Zeit., Vol. 2, p. 135, 1937. quote a figure of 4% for music, for both square and cube-law distortion.
The above results agree reasonably well with our calculations, but a number of observers using single or only a few sine tones have obtained lower values.
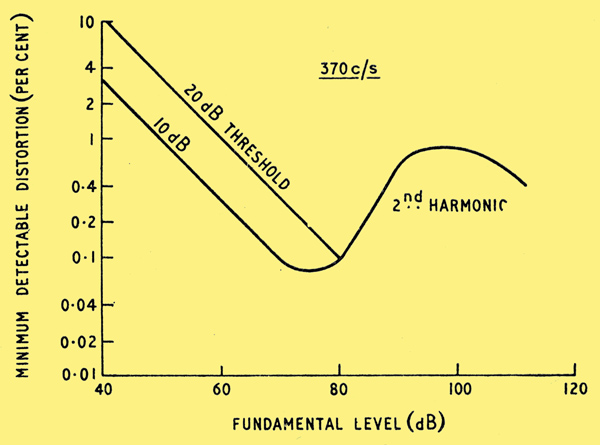
Fig. 9. Practical results of Newman, Stevens and Davies for 2nd harmonic distortion of 370 Hz.
Those of Newman, Stevens and Davies [14] J Acous. Soc. Amer, Vol. 9, p. 107, 1937. for the minimum detectable second harmonic distortion of 370 Hz (average for two observers) are reproduced in Fig. 9. Using two tones of frequency ratio 1.5 to 1 at a level of 60 dB Haar [15] Frequenz, Vol. 6, p. 199, 1952. obtained 0.3 and 0.5% for square and cube-law distortion respectively at frequencies between about 1000 and 4000 Hz. In this case then, square-law distortion was easier to detect than cube law. The threshold level was 0 dB at 1000 Hz, ie there was apparently no masking by noise.
Detailed sets of results for both square and cube-law distortion at various frequencies and levels have been given by Haar [15] Frequenz, Vol. 6, p. 199, 1952. and Feldtkeller [16] Akust. Beihefte, Vol. 3, p. 117, 1952. [17] Proc. 1st ICA Congress on Electro-Acoustics, 1953, 71. Published also in Acustica, Vol. 4, p. 70, 1954. those of Haar being for single frequencies (corresponding to Fig. 3), and those of Feldtkeller for two frequencies of ratio 1.5 to 1 (corresponding to Fig. 6). At levels up to about 60 dB both these sets of results agree quite well with our calculations if we insert a suitable threshold level, and this level turns out to be within about 6 dB of the stated level in each case. At levels above 60 dB the results are fragmentary, but appear to disagree with our calculations in two ways. Thus at a given level the smallest detectable distortion decreases with increasing frequency up to at least 1000 Hz (in Haars results up to at least 2000 Hz). The smallest detectable distortion at about 3 kHz also appears to decrease with increasing level up to at least 80 dB, the lowest figures quoted by Haar and Feldtkeller being 0.5 and 0.3% respectively.
The results of references 13, 15, 16 and 17 all show an increase at low frequencies. Thus Braunmühl and Weber [13] Akust. Zeit., Vol. 2, p. 135, 1937. give 2% for second harmonic distortion of 100 Hz; and Haars [15] Frequenz, Vol. 6, p. 199, 1952. results show a minimum at about 70 dB of 7% and 3% for second and third harmonic distortion of 100 Hz respectively. Haars results for 100 and 150 Hz together at a level of 70 dB are directly comparable with our Fig. 8. His values of 5.2 and 1.8% for square and cube-law distortion respectively are however much lower than those in Fig. 8. Feldtkellers results [16] Akust. Beihefte, Vol. 3, p. 117, 1952. for the same frequencies show similar values of about 5% and 1% (average for two observers) at their minima around 70 dB.
Extending our various calculations shows that the hearing sensitivity to distortion due to higher harmonics increases rapidly with increasing harmonic number. This effect is well known. It may explain another observation by Olson [10] Elements of Acoustical Engineering, p. 488. D. Van Nostrand Co., that if the higher frequencies are removed the sensitivity to total distortion is decreased.
References
- Radio Designers Handbook by F Langford-Smith, 4th Edn., p. 621. Iliffe and Sons, Ltd. From curves given by the Jensen Mfg Co.
- J Acous. Soc. Amer., Vol. 4, p. 288, 1933.
- Proc. IRE, V01. 36, p. 457, 1948.
- J Acous. Soc. Amer., Vol. 1, p. 311, 1930. The results are reproduced in Hearing: Its Psychology and Physiology by S S Stevens and H Davis. John Wiley and Sons, and Chapman and Hall.
- J Acous. Soc. Amer., Vol. 14, p. 159, 1942.
- J Acous. Soc. Amer., Vol. 28, p. 852, 1956.
- J Acous. Soc. Amer., Vol. 23, p. 275, 1951.
- Ann. d. Physik, Vol. 20, p. 809, 1934.
- Speech and Hearing, p. 149. D. Van Nostrand Co.
- Elements of Acoustical Engineering, p. 488. D. Van Nostrand Co.
- Radio and TV News, Vol. 44, p. 60, 1950.
- Wireless World, Vol. 59, p. 2, 1953.
- Akust. Zeit., Vol. 2, p. 135, 1937.
- J Acous. Soc. Amer, Vol. 9, p. 107, 1937.
- Frequenz, Vol. 6, p. 199, 1952.
- Akust. Beihefte, Vol. 3, p. 117, 1952.
- Proc. 1st ICA Congress on Electro-Acoustics, 1953, 71. Published also in Acustica, Vol. 4, p. 70, 1954.
Dyne per Square Centimeter is one of the smallest pressure units and is derived from the CGS unit for force where 1 Dyne equals 1 gram accelerated by 1 centimeter per second per second. 1 Dyne per Square Centimetre equals 0.1 Pascals. For more conversions see SensorsONE
|